Team Dashboard with New Features
With the October 14 update, the new team dashboard went live! After making training focus overviews available in recent weeks, our next goal was to process even more data and display it clearly. As a coach, you should have important team data immediately available on the team dashboard.
What’s New?
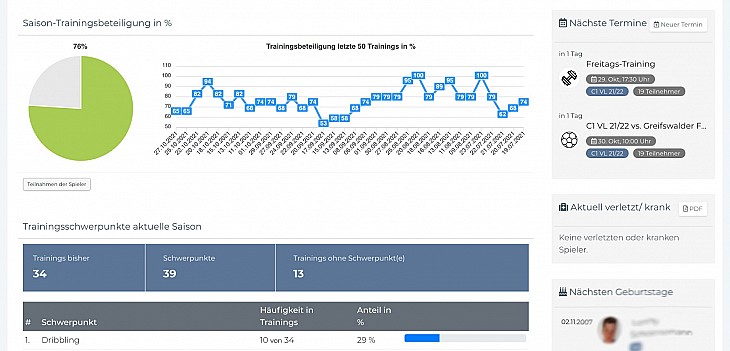
The dashboard now includes various charts to improve data visualization. In addition to the average training participation for the current season, you can now see a graph for the last 50 training sessions. This allows you to monitor attendance trends—if participation has steadily declined over recent weeks (without a flu outbreak or external commitments), it might be time to rethink your training approach! ;-)
Alongside training data, we’ve also upgraded match analysis. You can now track:
Total matches played
Breakdown of home and away matches
Win, draw, and loss distribution in a dedicated chart
More detailed goal statistics: total goals scored and conceded
New parameters: goals are now categorized by home and away performance
Average goals per match, home match, and away match
New goal timing charts displaying goals and conceded goals by match minute
What Was Already There?
The top offensive players overview, which has been available for a while, has now received a design refresh.
In proSports.Zone, assists and pre-assists (the pass before the assist) are tracked in addition to goals. Our software calculates the scoring value of each player based on these contributions.
The dashboard table provides key performance stats, allowing you to:
Sort by different criteria
Identify your most valuable offensive players at a glance
Stay tuned for even more exciting updates coming soon!
